The most populated cities in the world.
Based on the following data, draw a line graph to reflect the temporal evolution of the number of inhabitants of the cities shown in the four series (include Mexico and Sao Paola, although they do not meet the previous criterion). The population is expressed in millions inhabitants.
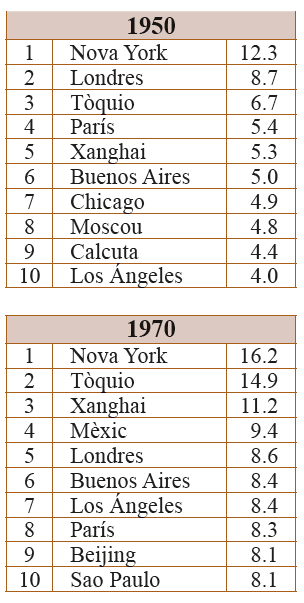
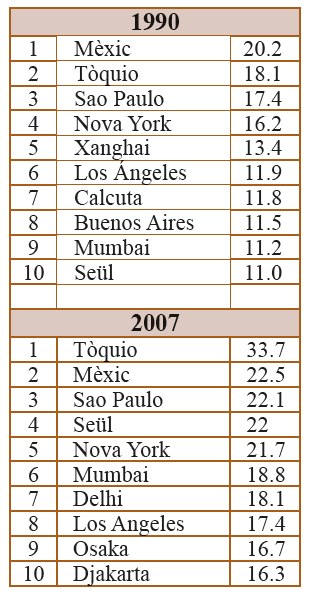
SOURCE: Geography 3º ESO. Gea-Clío project.
Creating a digital presentation (powerpoint).
- Choose any of the cities shown in the four tables of the previous activity and do a brief research report on it. Reflect the information collected in a digital presentation, and once revised, explain it to your classmates. The following information should be included:
- Geographic location of the city (map).
- Local weather and other physical aspects.
- Brief reference the country where it is located.
- History of the city.
- City map.
- Green areas.
- Pollution.
- Security.
- Humble quarters: location and characteristics.
- Culturally significant spaces (museums, theatres, etc).